
Interactive visual manipulation of large-scale line data
Short Abstract
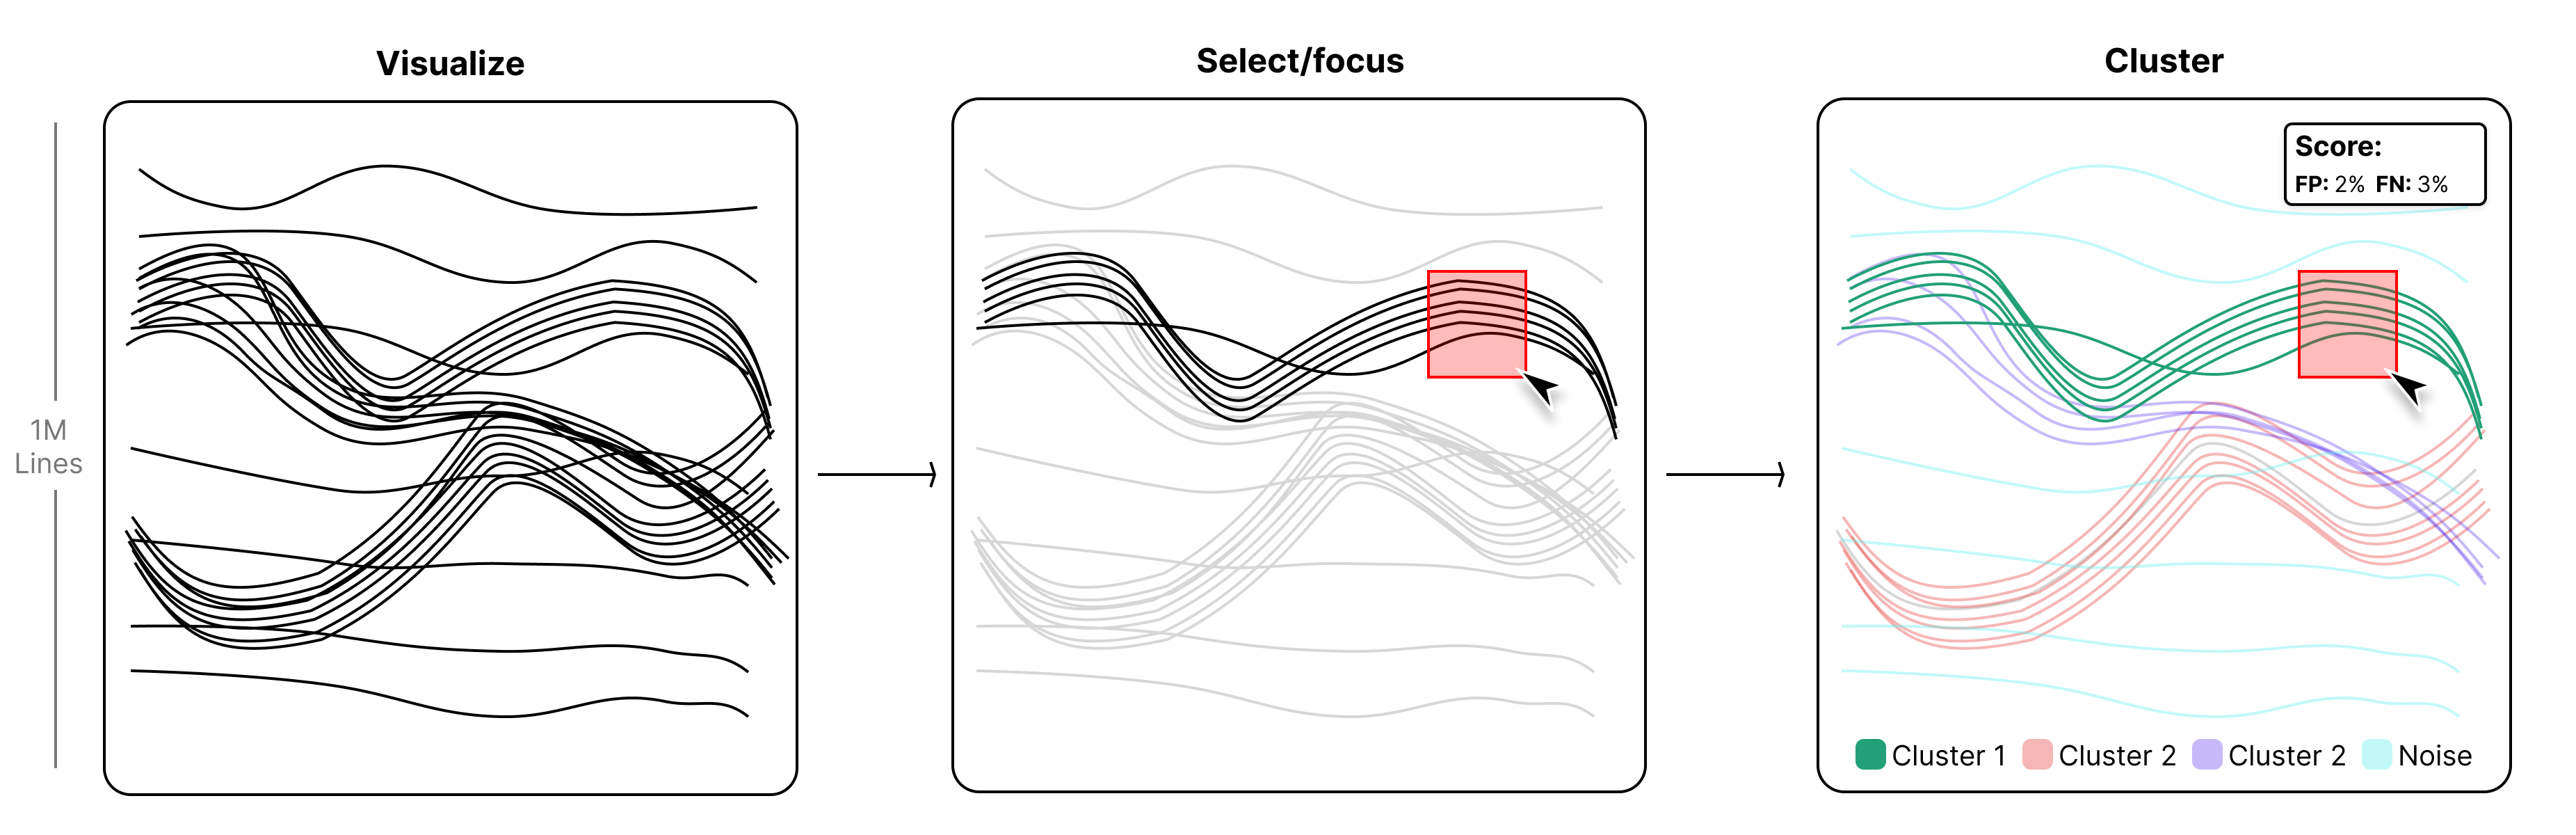
As datasets grow in size, the demand for efficient rendering and manipulation of this data intensifies. This research paper explores how GPU shaders can significantly enhance the processing of large-scale line data. In addition, various (semi-automatic) interaction tools are explored to optimally cluster line data and effectively select certain lines to be in or out of focus.
Visual abstract
Title and Research Question
Interactive visual manipulation of large-scale line data
The term “large scale” refers to thousands or millions of Paralell Coordinate Plot (PCP) lines; this can be, for example, millions of Reflectance Imaging Spectroscopy (RIS) data lines [PGK*22] or large-scale weather data [DPD*17] [ZSE*15]. I would like to focus on fuzzy-clustering [SSLC02] line groups by guiding expert users to pull certain lines in or out of context. My research questions are as follows:
- (Main question) How can, an expert using the system developed in this paper, effectively cluster large-scale line data with minimal effort?
- How to optimally (with as few clicks) select certain lines to be in or out of focus?
- How to make the rendering of large-scale line data more efficient?
- How to help a user to cluster lines in a semi-automatic way? And, when a automatic selection is made, how to make sure it is what the user actually expected to select?
Background
To gain a better understanding of how this research differs from previous work, it is important to understand the current state of the art. This section explains in a short review what existing research has been done in the following three key areas: large-scale high-dimensional data selection, data rendering techniques, and line data clustering methodologies.
Many authors have attempted to solve the problem of clustering (large-scale) point data
. This is done by using a variety of techniques, such as the use of a Mahalanobis brush [FH21] or a fuzzy classifier or K-means++ clustering with a lightweight neural network [WWS*23]. This paper will borrow some of these techniques and apply them to 2D line data.Fewer research has been done on clustering large-scale line data. One of the few papers that has been written about this is the work by T.Trautner et al. [TB21]. Their paper assumed that the data was pre-clustered and only focused on the rendering of this data. However, the methods in the paper do prioritise well-segmented clusters and renders lines in a way that makes them stand out. This paper will focus on effective clustering of the line data and will use the rendering technique as a way to show the user the clusters.
When lines are not yet clustered, it can be difficult to differentiate lines. A line plot with many groups (>6) is commonly called a “spaghetti plot” [DHH*02]. These plots are often used in meteorology to visualize weather patterns [SZD*10]. A common downside is: “many lines visualized in one plot can be hard to read for an expert”. A trivial way to reduce this clutter, is to display lines with certain channels from T. Munzner [M14]. like color, size, and transparency. These three caracteristics are forinstance used by A. Kamal et al. [KDJ*21]. They assume that the lines originate from a certain mean-line that has multiple branches of noise, the dataset is encoded using color (gradients) to visualize line uncertainties.
Lines can be aggregated to simplify the plot. One way is to measure each line as being typical or outlying. P. Micheaux et al. [DMV20] proposes a new statistical method called curve depth that helps analyze data represented as curves or trajectories and labels each line as typical or outlying. Aggregating with (Iso)contours is another common visualization technique to reduce clutter in spaghetti plots [PWB*09]. F. Ferstl [FKRW16] extends this idea by incorporating conditional probability visualizations to reveal joint occurrences of contours across different regions, offering a more informative and less cluttered alternative to traditional spaghetti plots.
Another statistical method is the use of Curve Density Estimates [LH11]. This method is able to give a rough sense of the how the data is distributed in certain areas. When a million lines are drawn in a plot on an average screen of 1920x1080, the expected number of overlapping lines at each pixel is ~1000:1. With density methods users are able to base their clustering on the density of lines. In addition, this extra context could give semi-automatic clustering a better starting point by selecting some equally dense areas across the x-axis.
To automate the work of clustering, J.Wei et al. [WYCM11] introduces a GPU-optimized Expectation Maximization algorithm for clustering large-scale point data. Although this method is able to establish a great seed for reaching a local optimum, expert-led clustering is expected to achieve a better clustering [BDTSW22].
An expert lead tool has been developed by A. Popa [PGK*22]. This tool allows the user to map the line data with the help of t-SNE to a 2D point cloud. A multi-view approach is used to show the user the point and line data at the same time. By clustering the point data, the user can view what lines are in the same cluster. This paper will focus on extending their tool to a higher dimension by directly selecting lines.
Evaluation metric
These evaluation metrics will be based on a user study with a few experts in various fields to find out if the applicaiton can be used to cluster lines in most general cases. The main evaluation metrics will be:
- A user is able to select and group out of a large co-hort of lines with low FP/FN
- When a semi-automatic brush is implemented, the stearing of the user should be as minimal as posible. This means the automatic part should score at least some percentage in some artificial/real datasets when selecting/grouping lines.
- As an additional benefit of the project, it should be straightforward to create your own data plot using your own dataset.
Weekly planning
As my thesis will be user-driven I will spend at least a few hours every week on some user feedback. I have planned the weekly schedule fairly conservatively; some weeks could eventually contain +50% of the work as listed below. However, due to my user-driven approach, I must remain flexible and adjust my planning based on the feedback I receive. The current planning is as broadly as follows:
- Week 1-3: How to select lines using a basic brush
- Week 4-6: Research and implement an effective way to cluster lines
- Week 7-9: Implement a semi-automatic brush to give the user some guidance
Basic user feedback can occur after week 6, while the core of the application can be tested after week 9. The time beyond week 9 will be used to enhance the application further and explore how its core can be extended toward a more standalone technical paper.
- Q1 - Have the core of the application ready for meaningfull user feedback
- Q2 - Explore possible extensions (as listed below)
- Q3 - In addition to implementing others’ work, I will delve deeper into the technical details of rendering the lines. This will elevate the paper beyond simply being an application that renders a pre-selected dataset. A potential end goal could be to also render graphs, area plots, or other examples from the D3 library.
Possible extensions
Based on the results of the first nine weeks, I will decide on the next steps. These could be:
- Going in depth on the rendering of millions of lines in a WebGPU environment
- Implementing a more advanced brush
- Use edge bundeling [LHT17] to simplify the number of lines being drawn
- Implement multiple (3+) levels of focus/context. For giving the user a better way to focus on what lines are more or less likely to be added to the current selection. Forinstance:
- Selected lines (Highlight colour + Shadow)
- Selected Cluster groups (Faded Colour)
- Unselected Cluster groups (Display as Mean+Std similar to A. Popa [PGK*22])
- Noise lines (blurred in the background)
- All other lines (Density plot)
During the Seminar
- (Research) the work by T. Trautner (Line Weaver, Honeycomb Plots, Sunspot Plots)
- (Implement) a WebGL version of [TB21] in 3D
Weeks ≤0 - Feb 1 - Mar 14
- (Implement) Setup a prototype of rendering 1k/1M lines in WebGPU.
- (Research) Decide on a Title and Research Question
- (Research) Read first chapter (basics) of (webgpufundamentals)
- (Write) Write a formal research proposal
Week 1 - Mar 17 - 21 (Research week)
- (Implement) Have the ability to select one line across all dimensions
- (Research) Read all 5 chapters of (webgpufundamentals)
- (Research) Read WebGPU — All of the cores, none of the canvas
Week 2 - Mar 24 - 28 (Going in depth)
- (Implement) Render the selected lines on top using a depth buffer
- (Implement) Make both ROW and COLUMN sizes based on data instead of hardcoded
- (Research) How to best select lines (Mahalanobis brush by C. Fan et al.) or find others
Week 3 - Mar 31 - Apr 4 (Selection week)
- (Implement) Enable the ability to select multiple lines, allowing users to create, add, remove, or delete the chosen lines.
- (Research) Read about Structured Brushing [RSM*15] papers
- (Write) Setup overleaf file
Week 4 - Apr 7 - 11 (UI/UX week)
- (Implement) Add the ability to create groups in the data.
- (Implement) Hide already created groups
- (Implement) Have the ability to show your False- Positive/Negative scores (or other evaluation metrics)
Week 5 - Apr 14 - 18 (Focus/Context week)
- (Implement) Make lines more pop-out similar to those described in the paper about Line Weaver or linking&brushing
- (Implement) Merging/Splitting of clusters
Week 6 - Apr 21 - 25
- (Research) Read on how a simple ML brush can better segment/cluster lines
- (Research) How to automatically naively cluster lines
- (Write) Evaluation metric / User study guidelines
Week 7 - Apr 28 - May 2
- (Implement) Simple ML based brush
- (implement) Automatic naive clustering
- (Research) Read on how a fuzzy classifier can be used to have a line be categorised in multiple clusters
Week 8 - May 6 - 9
- (Implement) Some fuzzy-clustering brushes
- (Research) Read on how lines can be drawn more efficiently in a buffer
- (Write) Background section
Week 9 - May 12 - 16
- (Implement) All about performance
- (Write) Introduction
Week 10 - May 19 - 23
- (Implement) Tidy up the codebase to make it more extendable.
- (implement) Sub-sampling
- (Write) Format/Review the first version of the research paper
Week 11… - May 26
- (implement) Allow the user to upload their own data
- (implement) Extend the Manivault application to embed the methods described above
- (Write) Abstract, Method, Discussion & Conclusion